


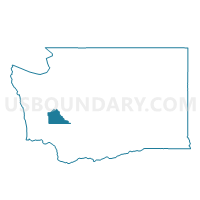
Thurston South CCD, Thurston County, Washington
About
Outline

Summary
| Unique Area Identifier | 155676 |
| Name | Thurston South CCD |
| County | Thurston County |
| State | Washington |
| Area (square miles) | 383.65 |
| Land Area (square miles) | 375.57 |
| Water Area (square miles) | 8.08 |
| % of Land Area | 97.90 |
| % of Water Area | 2.10 |
| Latitude of the Internal Point | 46.83929880 |
| Longtitude of the Internal Point | -122.77227440 |
| Total Population | 39,485 |
| Total Housing Units | 15,922 |
| Total Households | 14,688 |
| Median Age | 40 |
Maps

Graphs
Select a template below for downloading or customizing gragh for Thurston South CCD, Thurston County, Washington


Neighbors
Neighoring County Subdivision (by Name) Neighboring County Subdivision on the Map
- Bunker CCD, Lewis County, WA
- Centralia-Chehalis CCD, Lewis County, WA
- Eatonville CCD, Pierce County, WA
- Logan Hill CCD, Lewis County, WA
- Malone-Porter CCD, Grays Harbor County, WA
- Mineral CCD, Lewis County, WA
- Oakville CCD, Grays Harbor County, WA
- Olympia CCD, Thurston County, WA
- Olympia East CCD, Thurston County, WA
- Olympia West CCD, Thurston County, WA
- Roy CCD, Pierce County, WA
Top 10 Neighboring Place (by Population) Neighboring Place on the Map
- Lacey city, WA (42,393)
- Grand Mound CDP, WA (2,981)
- Rochester CDP, WA (2,388)
- Fords Prairie CDP, WA (1,959)
- Rainier city, WA (1,794)
- Tenino city, WA (1,695)
- McKenna CDP, WA (716)
- Bucoda town, WA (562)
- La Grande CDP, WA (109)
Top 10 Neighboring Unified School District (by Population) Neighboring Unified School District on the Map
- North Thurston Public Schools, WA (94,104)
- Tumwater School District, WA (36,566)
- Yelm Community Schools, WA (29,740)
- Centralia School District, WA (22,909)
- Chehalis School District, WA (14,527)
- Rochester School District, WA (14,285)
- Eatonville School District, WA (12,084)
- Tenino School District, WA (9,479)
- Onalaska School District, WA (5,293)
- Rainier School District, WA (5,062)
Top 10 Neighboring State Legislative District Lower Chamber (by Population) Neighboring State Legislative District Lower Chamber on the Map
- State House District 2, WA (163,707)
- State House District 22, WA (141,695)
- State House District 20, WA (141,029)
- State House District 35, WA (138,142)
Top 10 Neighboring State Legislative District Upper Chamber (by Population) Neighboring State Legislative District Upper Chamber on the Map
- State Senate District 2, WA (163,707)
- State Senate District 22, WA (141,695)
- State Senate District 20, WA (141,029)
- State Senate District 35, WA (138,142)
Top 10 Neighboring 111th Congressional District (by Population) Neighboring 111th Congressional District on the Map
- Congressional District 8, WA (810,754)
- Congressional District 3, WA (779,348)
- Congressional District 9, WA (723,129)
- Congressional District 6, WA (709,570)
Top 10 Neighboring Census Tract (by Population) Neighboring Census Tract on the Map
- Census Tract 124.11, Thurston County, WA (7,354)
- Census Tract 125.20, Thurston County, WA (7,154)
- Census Tract 127.20, Thurston County, WA (6,400)
- Census Tract 127.30, Thurston County, WA (6,342)
- Census Tract 732, Pierce County, WA (6,220)
- Census Tract 730.01, Pierce County, WA (6,082)
- Census Tract 9704, Lewis County, WA (5,703)
- Census Tract 126.10, Thurston County, WA (5,682)
- Census Tract 116.23, Thurston County, WA (5,581)
- Census Tract 9703, Lewis County, WA (4,973)
Top 10 Neighboring 5-Digit ZIP Code Tabulation Area (by Population) Neighboring 5-Digit ZIP Code Tabulation Area on the Map
- 98501, WA (38,133)
- 98513, WA (31,975)
- 98512, WA (28,130)
- 98531, WA (24,121)
- 98532, WA (23,596)
- 98597, WA (21,557)
- 98579, WA (12,870)
- 98580, WA (11,099)
- 98328, WA (10,433)
- 98589, WA (7,320)
Data
Demographic, Population, Households, and Housing Units
** Data sources from census 2010 **
Show Data on Map
Download Full List as CSV
Download Quick Sheet as CSV
| Subject | This Area | Thurston County | Washington | National |
|---|---|---|---|---|
| POPULATION | ||||
| Total Population Map | 39,485 | 252,264 | 6,724,540 | 308,745,538 |
| POPULATION, HISPANIC OR LATINO ORIGIN | ||||
| Not Hispanic or Latino Map | 36,693 | 234,477 | 5,968,750 | 258,267,944 |
| Hispanic or Latino Map | 2,792 | 17,787 | 755,790 | 50,477,594 |
| POPULATION, RACE | ||||
| White alone Map | 35,053 | 207,856 | 5,196,362 | 223,553,265 |
| Black or African American alone Map | 472 | 6,752 | 240,042 | 38,929,319 |
| American Indian and Alaska Native alone Map | 588 | 3,515 | 103,869 | 2,932,248 |
| Asian alone Map | 476 | 13,037 | 481,067 | 14,674,252 |
| Native Hawaiian and Other Pacific Islander alone Map | 93 | 1,961 | 40,475 | 540,013 |
| Some Other Race alone Map | 1,171 | 5,648 | 349,799 | 19,107,368 |
| Two or More Races Map | 1,632 | 13,495 | 312,926 | 9,009,073 |
| POPULATION, SEX | ||||
| Male Map | 20,003 | 122,952 | 3,349,707 | 151,781,326 |
| Female Map | 19,482 | 129,312 | 3,374,833 | 156,964,212 |
| POPULATION, AGE (18 YEARS) | ||||
| 18 years and over Map | 29,949 | 194,142 | 5,143,186 | 234,564,071 |
| Under 18 years | 9,536 | 58,122 | 1,581,354 | 74,181,467 |
| POPULATION, AGE | ||||
| Under 5 years | 2,371 | 15,381 | 439,657 | 20,201,362 |
| 5 to 9 years | 2,500 | 15,629 | 429,877 | 20,348,657 |
| 10 to 14 years | 2,768 | 16,559 | 438,233 | 20,677,194 |
| 15 to 17 years | 1,897 | 10,553 | 273,587 | 12,954,254 |
| 18 and 19 years | 1,002 | 6,663 | 188,541 | 9,086,089 |
| 20 years | 416 | 3,305 | 94,086 | 4,519,129 |
| 21 years | 356 | 3,294 | 91,883 | 4,354,294 |
| 22 to 24 years | 1,101 | 9,726 | 275,543 | 12,712,576 |
| 25 to 29 years | 2,169 | 17,406 | 480,398 | 21,101,849 |
| 30 to 34 years | 2,498 | 16,609 | 453,383 | 19,962,099 |
| 35 to 39 years | 2,639 | 16,276 | 448,607 | 20,179,642 |
| 40 to 44 years | 2,778 | 16,731 | 459,698 | 20,890,964 |
| 45 to 49 years | 3,249 | 18,108 | 492,909 | 22,708,591 |
| 50 to 54 years | 3,300 | 18,935 | 495,296 | 22,298,125 |
| 55 to 59 years | 3,099 | 18,485 | 453,078 | 19,664,805 |
| 60 and 61 years | 1,108 | 6,778 | 162,454 | 7,113,727 |
| 62 to 64 years | 1,484 | 9,062 | 219,633 | 9,704,197 |
| 65 and 66 years | 811 | 4,954 | 119,417 | 5,319,902 |
| 67 to 69 years | 1,069 | 6,058 | 151,057 | 7,115,361 |
| 70 to 74 years | 1,191 | 7,272 | 186,746 | 9,278,166 |
| 75 to 79 years | 854 | 5,557 | 142,068 | 7,317,795 |
| 80 to 84 years | 497 | 4,376 | 111,118 | 5,743,327 |
| 85 years and over | 328 | 4,547 | 117,271 | 5,493,433 |
| MEDIAN AGE BY SEX | ||||
| Both sexes Map | 40.00 | 38.50 | 37.30 | 37.20 |
| Male Map | 39.40 | 37.10 | 36.20 | 35.80 |
| Female Map | 40.70 | 39.80 | 38.30 | 38.50 |
| HOUSEHOLDS | ||||
| Total Households Map | 14,688 | 100,650 | 2,620,076 | 116,716,292 |
| HOUSEHOLDS, HOUSEHOLD TYPE | ||||
| Family households: Map | 10,746 | 66,161 | 1,687,455 | 77,538,296 |
| Husband-wife family Map | 8,457 | 50,237 | 1,288,849 | 56,510,377 |
| Other family: Map | 2,289 | 15,924 | 398,606 | 21,027,919 |
| Male householder, no wife present Map | 762 | 4,500 | 124,402 | 5,777,570 |
| Female householder, no husband present Map | 1,527 | 11,424 | 274,204 | 15,250,349 |
| Nonfamily households: Map | 3,942 | 34,489 | 932,621 | 39,177,996 |
| Householder living alone Map | 2,956 | 26,104 | 711,619 | 31,204,909 |
| Householder not living alone Map | 986 | 8,385 | 221,002 | 7,973,087 |
| HOUSEHOLDS, HISPANIC OR LATINO ORIGIN OF HOUSEHOLDER | ||||
| Not Hispanic or Latino householder: Map | 14,029 | 95,935 | 2,431,191 | 103,254,926 |
| Hispanic or Latino householder: Map | 659 | 4,715 | 188,885 | 13,461,366 |
| HOUSEHOLDS, RACE OF HOUSEHOLDER | ||||
| Householder who is White alone | 13,538 | 87,599 | 2,165,468 | 89,754,352 |
| Householder who is Black or African American alone | 124 | 2,615 | 89,745 | 14,129,983 |
| Householder who is American Indian and Alaska Native alone | 176 | 1,226 | 34,018 | 939,707 |
| Householder who is Asian alone | 128 | 4,062 | 158,224 | 4,632,164 |
| Householder who is Native Hawaiian and Other Pacific Islander alone | 26 | 535 | 10,785 | 143,932 |
| Householder who is Some Other Race alone | 296 | 1,576 | 88,530 | 4,916,427 |
| Householder who is Two or More Races | 400 | 3,037 | 73,306 | 2,199,727 |
| HOUSEHOLDS, HOUSEHOLD TYPE BY HOUSEHOLD SIZE | ||||
| Family households: Map | 10,746 | 66,161 | 1,687,455 | 77,538,296 |
| 2-person household Map | 4,789 | 30,043 | 728,493 | 31,882,616 |
| 3-person household Map | 2,358 | 15,397 | 378,423 | 17,765,829 |
| 4-person household Map | 2,069 | 12,446 | 327,428 | 15,214,075 |
| 5-person household Map | 938 | 5,234 | 148,156 | 7,411,997 |
| 6-person household Map | 364 | 1,936 | 61,229 | 3,026,278 |
| 7-or-more-person household Map | 228 | 1,105 | 43,726 | 2,237,501 |
| Nonfamily households: Map | 3,942 | 34,489 | 932,621 | 39,177,996 |
| 1-person household Map | 2,956 | 26,104 | 711,619 | 31,204,909 |
| 2-person household Map | 828 | 6,608 | 175,739 | 6,360,012 |
| 3-person household Map | 99 | 1,147 | 27,974 | 992,156 |
| 4-person household Map | 35 | 408 | 10,832 | 411,171 |
| 5-person household Map | 16 | 146 | 3,737 | 126,634 |
| 6-person household Map | 3 | 40 | 1,543 | 48,421 |
| 7-or-more-person household Map | 5 | 36 | 1,177 | 34,693 |
| HOUSING UNITS | ||||
| Total Housing Units Map | 15,922 | 108,182 | 2,885,677 | 131,704,730 |
| HOUSING UNITS, OCCUPANCY STATUS | ||||
| Occupied Map | 14,688 | 100,650 | 2,620,076 | 116,716,292 |
| Vacant Map | 1,234 | 7,532 | 265,601 | 14,988,438 |
| HOUSING UNITS, OCCUPIED, TENURE | ||||
| Owned with a mortgage or a loan Map | 9,014 | 50,458 | 1,245,264 | 52,979,430 |
| Owned free and clear Map | 2,808 | 16,611 | 428,656 | 23,006,644 |
| Renter occupied Map | 2,866 | 33,581 | 946,156 | 40,730,218 |
| HOUSING UNITS, VACANT, VACANCY STATUS | ||||
| For rent Map | 202 | 2,535 | 72,112 | 4,137,567 |
| Rented, not occupied Map | 7 | 157 | 4,877 | 206,825 |
| For sale only Map | 329 | 1,632 | 41,417 | 1,896,796 |
| Sold, not occupied Map | 58 | 316 | 7,623 | 421,032 |
| For seasonal, recreational, or occasional use Map | 334 | 1,445 | 89,907 | 4,649,298 |
| For migrant workers Map | 0 | 0 | 1,328 | 24,161 |
| Other vacant Map | 304 | 1,447 | 48,337 | 3,652,759 |
| HOUSING UNITS, OCCUPIED, AVERAGE HOUSEHOLD SIZE BY TENURE | ||||
| Total: Map | 2.64 | 2.46 | 2.51 | 2.58 |
| Owner occupied Map | 2.62 | 2.53 | 2.61 | 2.65 |
| Renter occupied Map | 2.72 | 2.33 | 2.35 | 2.44 |
| HOUSING UNITS, OCCUPIED, TENURE BY RACE OF HOUSEHOLDER | ||||
| Owner occupied: Map | 11,822 | 67,069 | 1,673,920 | 75,986,074 |
| Householder who is White alone Map | 11,000 | 59,724 | 1,453,731 | 63,446,275 |
| Householder who is Black or African American alone Map | 101 | 1,368 | 31,936 | 6,261,464 |
| Householder who is American Indian and Alaska Native alone Map | 126 | 675 | 16,941 | 509,588 |
| Householder who is Asian alone Map | 111 | 2,740 | 97,333 | 2,688,861 |
| Householder who is Native Hawaiian and Other Pacific Islander alone Map | 21 | 272 | 4,112 | 61,911 |
| Householder who is Some Other Race alone Map | 180 | 731 | 35,463 | 1,975,817 |
| Householder who is Two or More Races Map | 283 | 1,559 | 34,404 | 1,042,158 |
| Renter occupied: Map | 2,866 | 33,581 | 946,156 | 40,730,218 |
| Householder who is White alone Map | 2,538 | 27,875 | 711,737 | 26,308,077 |
| Householder who is Black or African American alone Map | 23 | 1,247 | 57,809 | 7,868,519 |
| Householder who is American Indian and Alaska Native alone Map | 50 | 551 | 17,077 | 430,119 |
| Householder who is Asian alone Map | 17 | 1,322 | 60,891 | 1,943,303 |
| Householder who is Native Hawaiian and Other Pacific Islander alone Map | 5 | 263 | 6,673 | 82,021 |
| Householder who is Some Other Race alone Map | 116 | 845 | 53,067 | 2,940,610 |
| Householder who is Two or More Races Map | 117 | 1,478 | 38,902 | 1,157,569 |
| HOUSING UNITS, OCCUPIED, TENURE BY HISPANIC OR LATINO ORIGIN OF HOUSEHOLDER | ||||
| Owner occupied: Map | 11,822 | 67,069 | 1,673,920 | 75,986,074 |
| Not Hispanic or Latino householder Map | 11,375 | 64,691 | 1,592,994 | 69,617,625 |
| Hispanic or Latino householder Map | 447 | 2,378 | 80,926 | 6,368,449 |
| Renter occupied: Map | 2,866 | 33,581 | 946,156 | 40,730,218 |
| Not Hispanic or Latino householder Map | 2,654 | 31,244 | 838,197 | 33,637,301 |
| Hispanic or Latino householder Map | 212 | 2,337 | 107,959 | 7,092,917 |
| HOUSING UNITS, OCCUPIED, TENURE BY HOUSEHOLD SIZE | ||||
| Owner occupied: Map | 11,822 | 67,069 | 1,673,920 | 75,986,074 |
| 1-person household Map | 2,205 | 14,015 | 353,279 | 16,453,569 |
| 2-person household Map | 4,828 | 27,122 | 646,313 | 27,618,605 |
| 3-person household Map | 1,970 | 11,125 | 268,039 | 12,517,563 |
| 4-person household Map | 1,666 | 9,174 | 238,736 | 10,998,793 |
| 5-person household Map | 708 | 3,580 | 100,123 | 5,057,765 |
| 6-person household Map | 269 | 1,307 | 39,967 | 1,965,796 |
| 7-or-more-person household Map | 176 | 746 | 27,463 | 1,373,983 |
| Renter occupied: Map | 2,866 | 33,581 | 946,156 | 40,730,218 |
| 1-person household Map | 751 | 12,089 | 358,340 | 14,751,340 |
| 2-person household Map | 789 | 9,529 | 257,919 | 10,624,023 |
| 3-person household Map | 487 | 5,419 | 138,358 | 6,240,422 |
| 4-person household Map | 438 | 3,680 | 99,524 | 4,626,453 |
| 5-person household Map | 246 | 1,800 | 51,770 | 2,480,866 |
| 6-person household Map | 98 | 669 | 22,805 | 1,108,903 |
| 7-or-more-person household Map | 57 | 395 | 17,440 | 898,211 |
Loading...